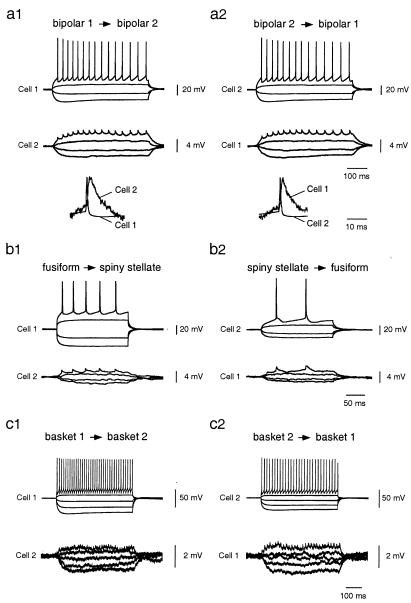
Figure 1.
Electrical coupling between cell pairs in different regions of the postnatal rat brain. (a) Electrical coupling between two bipolar GABAergic interneurons of layer 2/3 visual cortex. (b) Electrical coupling between layer 4 fusiform interneuron and spiny stellate neuron. (c) Electrical coupling between two hippocampal dentate gyrus basket cells. In all cases, the voltage response of cell 1 after current injection is also detectable in cell 2 and vice versa, although with a significantly reduced amplitude. Fast signals like action potentials showed a clearly distorted time course. This is most visible in the bottom traces of a, where a single reflected voltage response in cell 2 was scaled to the amplitude of the action potential in the current-injected cell 1 and vice versa. The recordings shown here were made in the presence of 5 μM 2,3-dihydroxy-6-nitro-7-sulfamoylbenzo[f]quinoxaline (NBQX) and 10 μM bicuculline to block chemical synapses.

