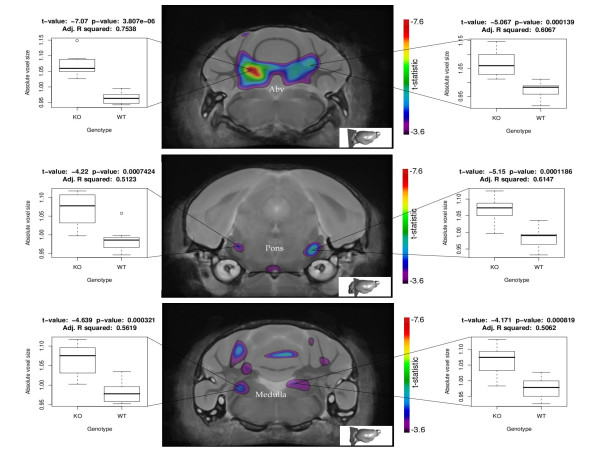
Figure 6.
MRI of the brain. The per-voxel results of the statistical map of the Jacobian determinant (tissue compression/expansion) are shown as composite images of two coronal sections of the GSK-3α KO brain compared to WT control brain. All colored voxels are significant with a false discovery rate of 10% (n = 9 for knock outs, n = 8 for wild types). The coronal level of each section is pictorially illustrated in the bottom right corner. Abv, arbor vita of the cerebellum, CbCx, cellebellar cortex, CrAq, cerebral aqueduct.

