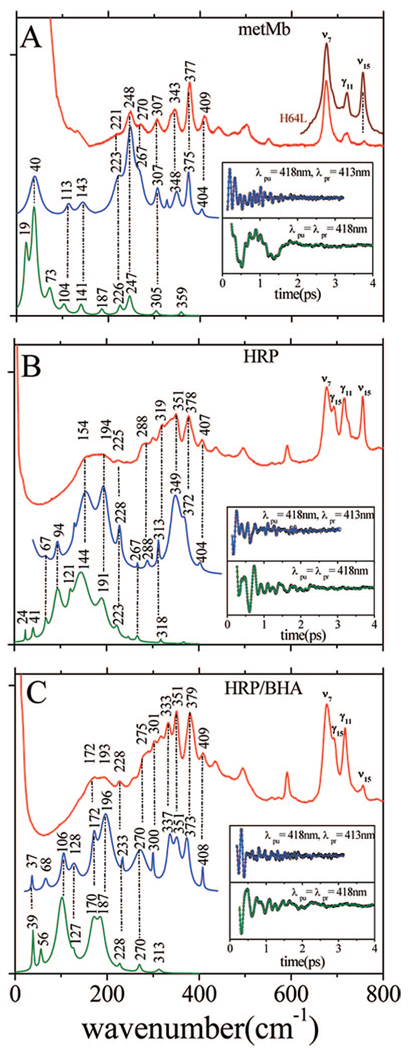
Figure 2.
(A) Correlations between the Raman and coherence spectra of ferric Mb. The Raman spectrum of the five-coordinate H64L Mb mutant in the 600–800 cm−1 region is also displayed to show the strong ν15 at 750 cm−1. (B) Correlations between the Raman and coherence spectra of native ferric HRP. (C) Correlations between the Raman and coherence spectra of ferric HRP/BHA. The inset shows the coherent oscillations and LPSVD fits corresponding to open band (green) and dispersed (blue) detection. The Raman data were measured with a 413.1 nm excitation wavelength, while the FCS data were measured using a 418 nm excitation. The dispersed data were measured with a 0.5 nm spectral window, detuned 5 nm to the blue of the carrier frequency maximum (λpr = 413 nm).

