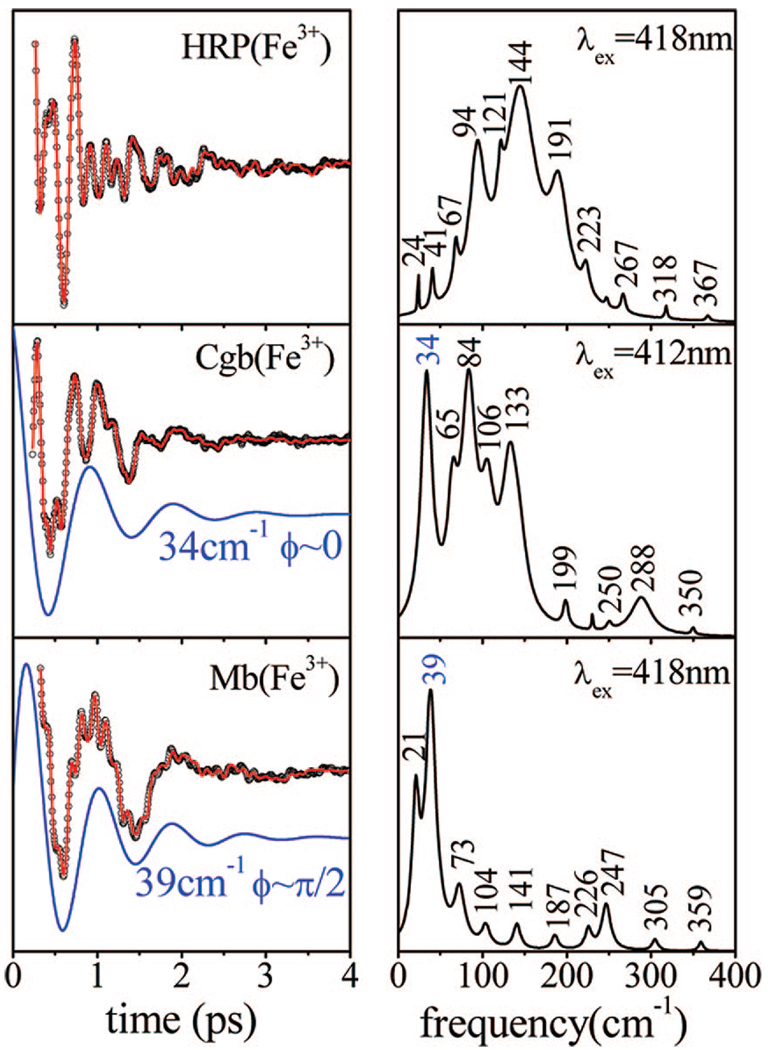
Figure 7.
Coherent oscillations and the LPSVD fits (left panel) of the native ferric species of HRP, Cgb, and Mb. The respective power spectra are displayed in the right panels. The experiments were run in an open band detection scheme, with excitation at 418 nm for HRP and Mb and 412 nm for Cgb. The 34 cm−1 mode of Cgb and the 39 cm−1 of Mb and their phases are shown displaced from the data.

