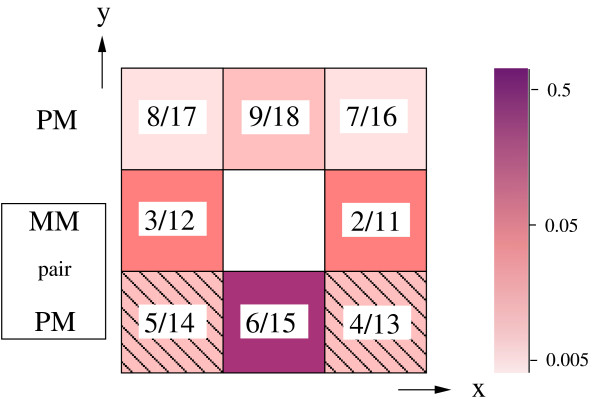
Figure 1.
Correlations with neighboring features. Schematic representation of the neighboring parameters on the array. The inset numbers indicate the corresponding parameter(s)  α, e.g. 3/12 represents
  3,
3,  12 respectively.
  2 through
  9 are related to purines,
  11 to
11 to  18 to pyrimidines. The bar to the right gives the intensity scale of the parameters. The dashed pattern indicates negative values. Box on the left indicates the rows of corresponding PM and MM pairs. The central feature (position (x, y)) is a MM; its corresponding PM is located just below it (x, y - 1), its intensity has the strongest correlation with the central MM feature. The features in (x ± 1, y - 1)

