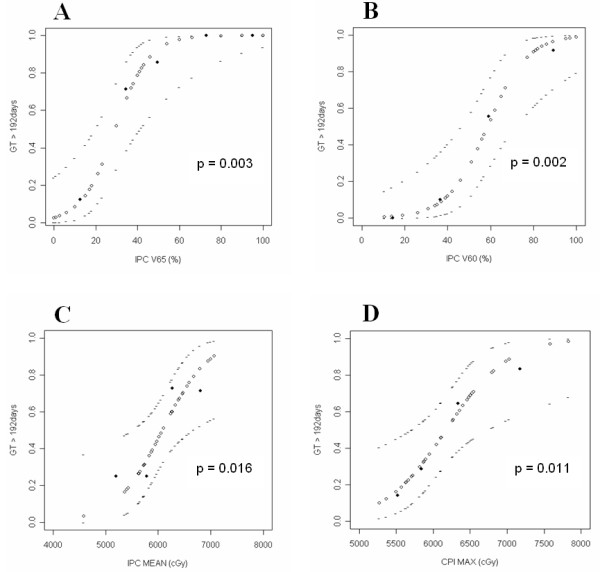
Figure 2.

Volume-response or dose-response relationship for the average probability of having prolonged GT dependence and the volume of the IPC receiving more than 6500 cGy (A), or 6000 cGy (B), or the mean dose to the IPC (C), or maximum dose to CPI (D). GT = gastrostomy tube; IPC = inferior pharyngeal constrictors; CPI = cricoid pharyngeal inlet. The ◇ lines plot the mean risk; the - lines plot the estimated upper and lower limits of 95% confidence interval. The ♦ points depict the observed values.
