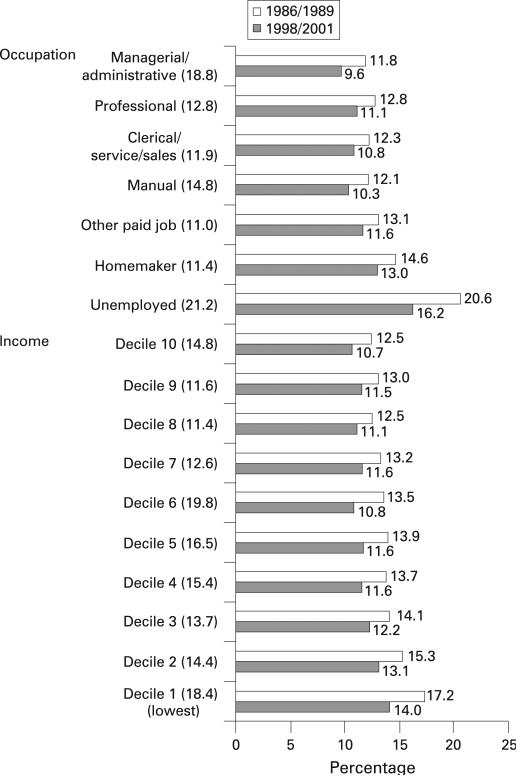
Figure 2.
Adjusted percentages in reporting fair or poor health by socioeconomic position before (1986/1989) and after (1998/2001) the economic crisis and its percentage reduction (in parenthesis); CSLC, Japan. Percentages are adjusted for age, gender, marital status, survey year and either income or occupation.

