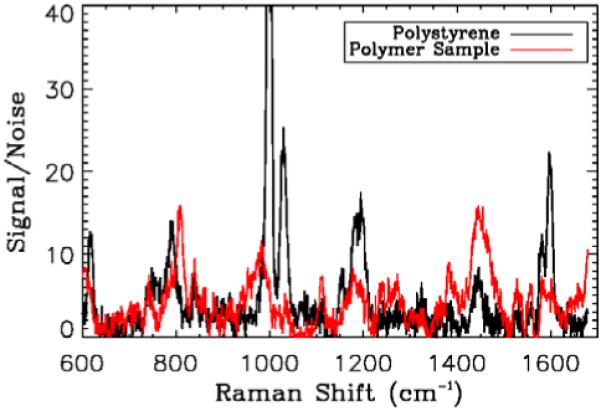
Figure 3.

(online color at: www.biophotonics-journal.org) Comparison of Raman spectra from the polystyrene and second polymer sample when not imbedded in the gel sample. The integration time for these samples was 5 s, much longer than the integration time during combined OCT-Raman acquisition. The two polymers have different Raman signals. Signals are divided by the standard deviation of a region in the spectrum with no peak and a background polynomial fit is removed.
