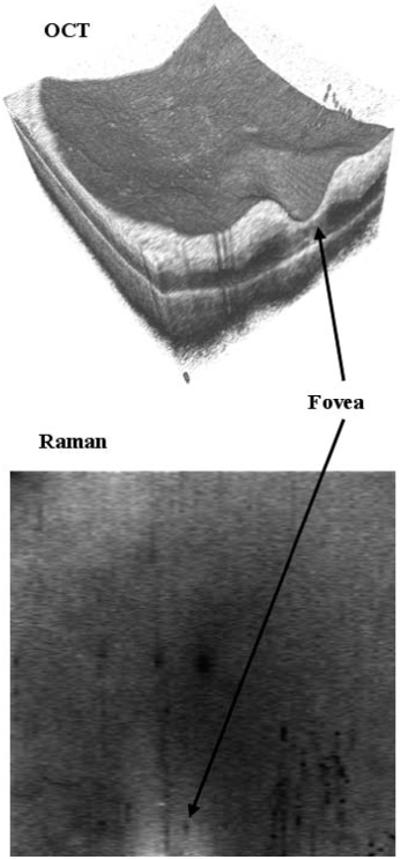
Figure 6.

OCT image and Raman spectral map of human retina sample acquired over a 4 × 4 mm area with 400 × 80 sampling points. The Raman map is the average intensity of the Raman spectra over the range 1500 to 1630 cm−1. Each spectrum had an integration time of 0.2 s and the total time to image the sample was about 2 h.
