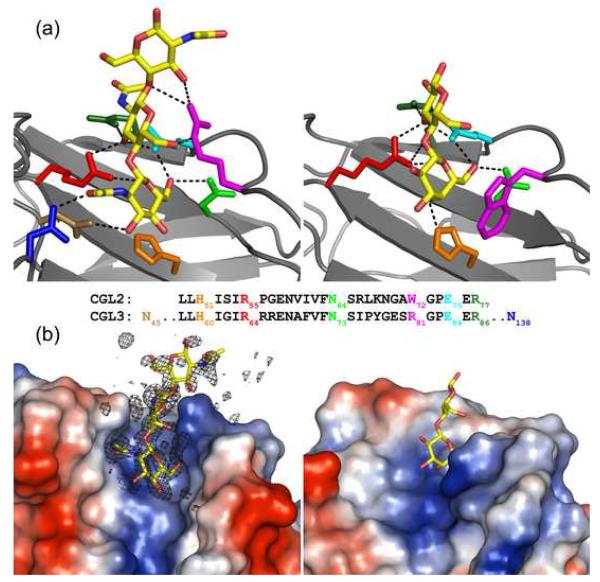
Figure 5. Comparison between carbohydrate coordination by CGL3 and CGL2.
(a) chitotriose coordination of CGL3 (left; PDB ID: 1R0H) and lactose coordination of CGL2 (right; PDB ID: 1ULC). Important amino acid side chains are displayed as sticks and colored according to the local sequence alignment in the middle of the figure. H-bonds are depicted as dashed black lines. (b) surface representation of the sugar binding pockets of the two lectins with the bound glycans shown as sticks. Protein electrostatics have been mapped onto the Connolly surface (vacuum electrostatics: red negatively, blue positively charged). The electron density for chitotriose is shown in the left panel as a simulated annealing omit map (Fo-Fc) contoured at 3.0 sigma.

