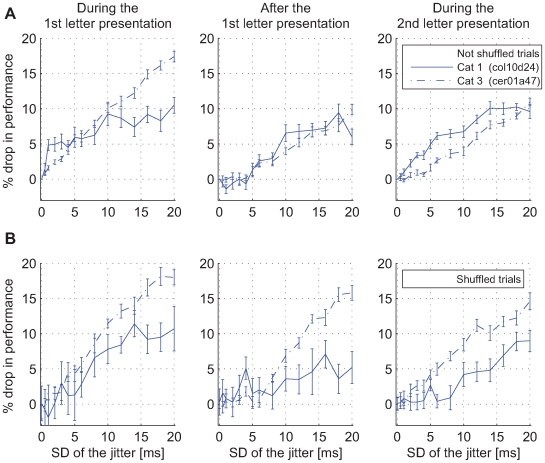
Figure 6. The performance of the classifiers Rt (from Figure 3) as a function of Gaussian jitter applied to spike timing.
(A) Change in classification performance as a function of the amount of jitter shown for the three points with the highest classification prior to the application of jitter. The results are shown for three different points in time exhibiting the strongest effects (cat 1: 60,120, and 200 ms; cat 3: 40, 120, and 230 ms). (B) The same analysis as in (A) but for spike trains shuffled across presentation trials (cat 1: 40, 130, and 220 ms; cat 3: 40, 120, and 250 ms). Vertical lines: standard error of the mean across all jittered and trial-shuffled datasets.

