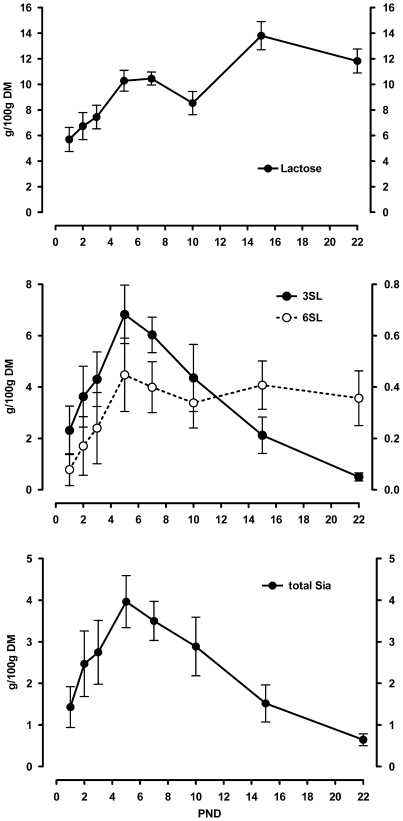
Figure 2. Rat milk lactose, sialyllactose and sialic acid content throughout lactation.
Lactose (upper panel), the sialyllactoses (middle panel; 3SL left scale bar; 6SL right scale bar) and total sialic acid (lower panel) contents were measured in non-stimulated rat milk over time of lactation. Amounts are expressed in g per 100 g dried milk. Mean and SD are shown (N = 5).

