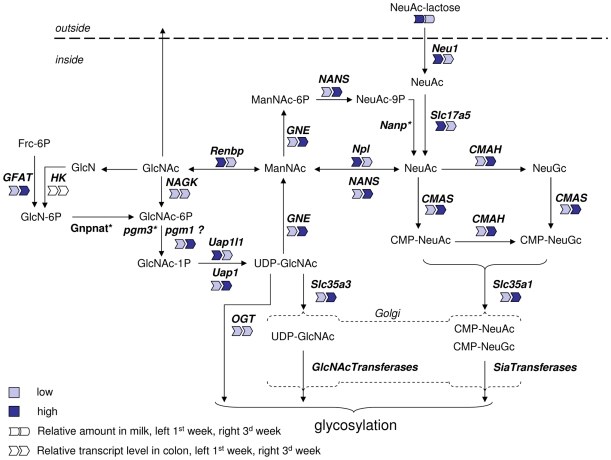
Figure 3. Schematic representation of sialic acid metabolism and a summary of gene expression levels in the colon.
The pathways depicted are based on the KEGG aminosugar reference pathway. Full names of the indicated gene/protein are given in the text. The relative gene expression level and milk sialic acid content during first and third week of lactation are indicated by symbols and color code. (*Gene not in array or not expressed; ‘?’ no data that pgm1 can catalyse this step.)

