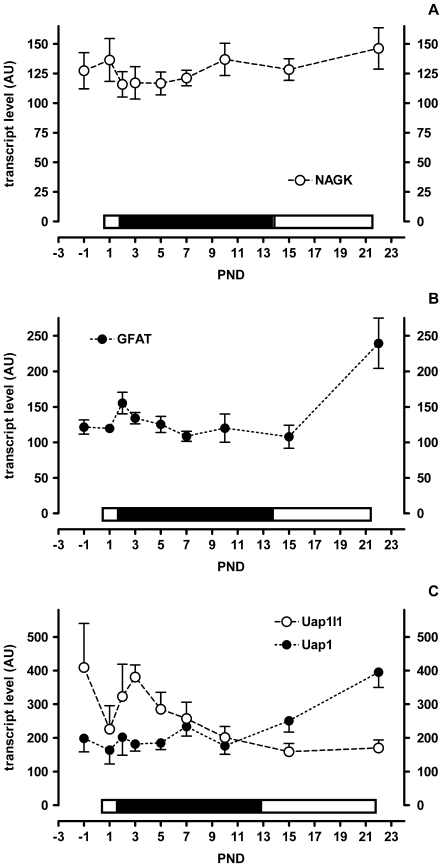
Figure 5. Colon gene expression levels in suckling rat pups.
A–C) Filled symbols apply to the left scale bar and open symbols to the right scale bar. Mean and SD are shown (N = 6, except PND-1 N = 5). The bar above each x-axis indicates the relative level of sialic acid in milk (low, open and high, filled).

