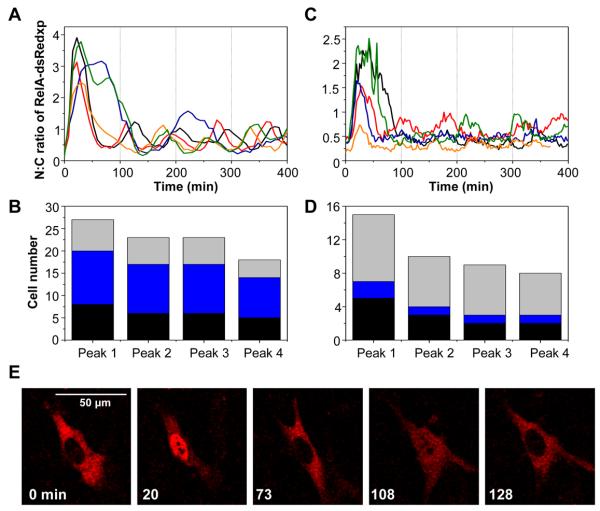
Fig. 1. RelA oscillations at the single cell level.
(A & C) Time-course of the ratio of nuclear to cytoplasmic localization (N:C) of RelA-dsRedxp in (A) SK-N-AS (stably transfected) and (C) MEF (transiently transfected) cells. Single cell dynamics are shown by different colored lines. (B & D) The number of cells (separate experiments represented by different colors) showing RelA-dsRedxp translocations in (B) stably transfected SK-N-AS (imaged for at least 350-min; 0 cells failed to respond) and (D) transiently transfected MEF cells (imaged for at least 250 min; 1 cell failed to respond). (E) Time-lapse confocal images of a typical RelA-dsRedxp-transfected MEF cell following TNFα stimulation.

