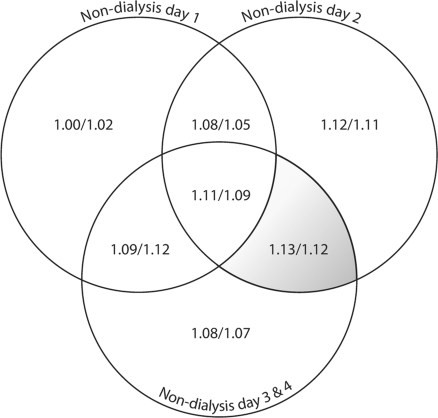
Fig. 1.
Relationship of mortality with home blood pressure monitoring obtained on various non-dialysis days. The circles represent the non-dialysis days. Non-dialysis days 3 and 4 represent the weekend. A combination of days (non-dialysis days 2 and over weekend) was statistically significant and is shaded.

