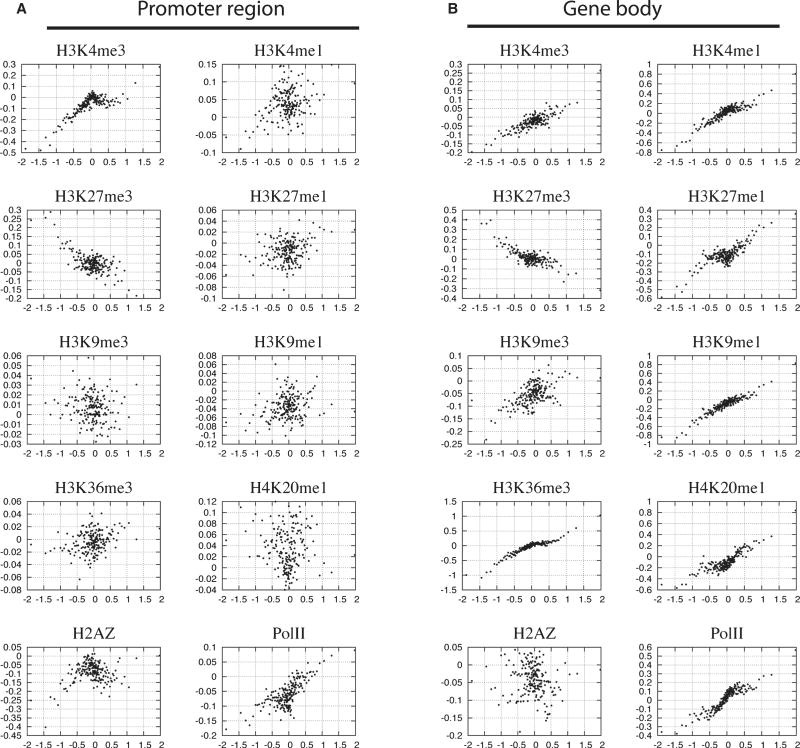
Figure 4. Correlation between changes in histone modification and gene expression during differentiation from CD133+ to CD36+ cells.
The fold changes in both expression level and histone modification level were calculated for each gene during differentiation. The genes were grouped into 100-gene sets according to their expression changes and the changes were averaged for each set of 100 genes (one dot in the figure); the histone modification changes were then averaged for the same sets of 100-genes. The y-axis indicates the fold change (log10 scale) of histone modification in the promoter region (A) or gene body region (B). The x-axis indicates that the fold change in expression levels. The clear gaps in some figures are due to cut-off thresholds of histone modification islands.

