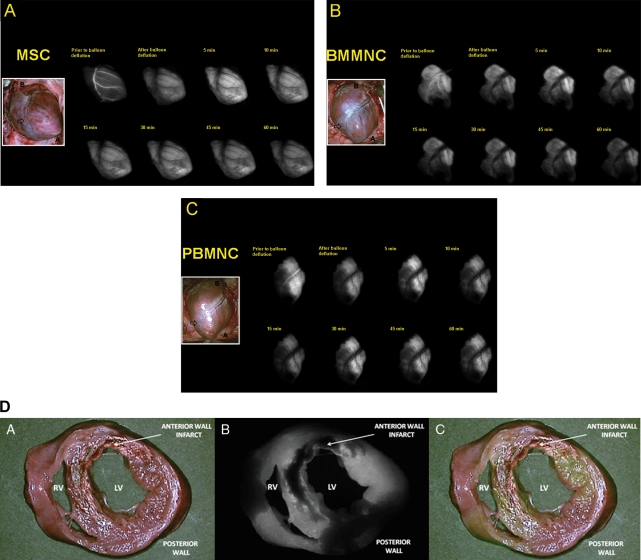
Figure 5.
Myocardial distribution of multipotent progenitor cells following intracoronary delivery. Near-infrared imaging data are captured at various tracking time points immediately after intracoronary delivery of MSCs (A), BMMNCs (B), and PBMNCs (C) in the setting of recent infarction. Multipotent progenitor cells readily distribute along the vascular territory of the infarct-related artery. Cell boluses are seen to occupy the intravascular space (top left panel in each figure) and then permeate myocardial tissue after balloon deflation. Shown inset is a colour image of the infarcted heart (B: base; A: apex; Infarct: anterior wall infarct zone); (D) Once injected by intracoronary route, MPCs were documented to penetrate the vascular territory perfused by the left anterior descending artery, in effect permeating the full thickness of the cardiac muscle. In this ‘bread loaf’ section of an infarcted heart after MSC injection, only the scarred area did not show evidence of NIR emission. (A: colour image; B: NIR image; C: merge image; INF: infarct zone; RV: right ventricle; LV: left ventricle).

