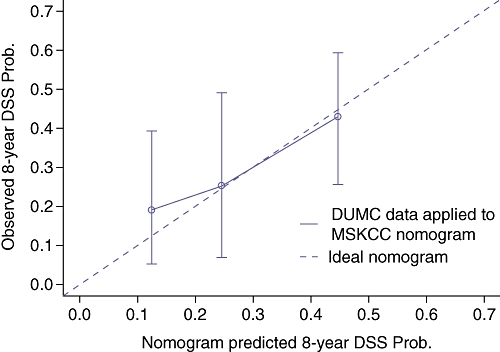
Figure 2.

Duke University Medical Center (DUMC) cohort calibration curve – observed disease-specific survival (DSS) versus nomogram predicted DSS. DUMC patients were stratified into three groups based on nomogram predicted DSS – vertical lines with error bars depict the performance of the Memorial-Sloan Kettering Cancer Center (MSKCC) nomogram applied to DUMC patients. The ideal nomogram is depicted by the diagonal line
