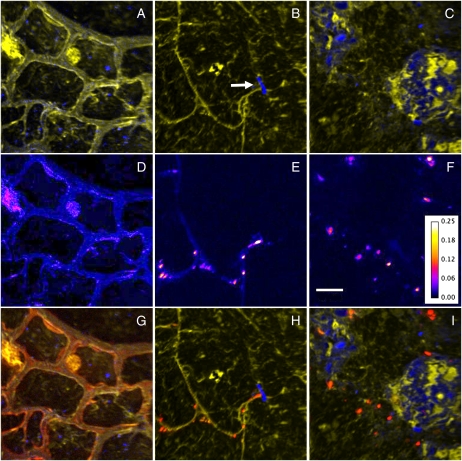
Figure 3.
NanoSIMS ion images highlighting in situ spatial relationships, coupled with levels of 15N enrichment. A to C, Overlays of 12C14N (yellow) and 28Si (blue) ion images representative of key regions: plant root cells (A), rhizosphere (B), and soil matrix (C). A root hair that has encountered a soil particle and diverged is seen in B (arrow). D to F, 15N/14N ratio images from same regions, showing areas of 15N enrichment. The color depicts the 15N/14N ratio, with the ratio scale shown in F. Bar = 5 μm. G to I, Overlay of 12C14N (yellow), 28Si (blue), and 12C15N/12C14N (red) images from each region.

