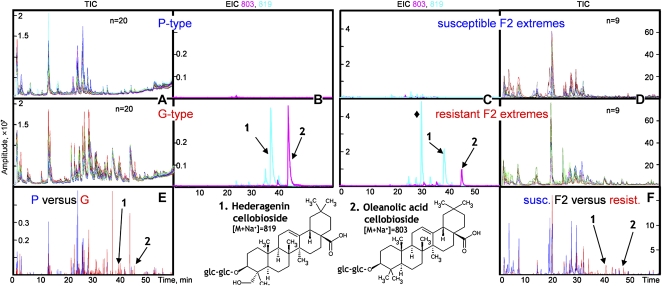
Figure 3.
Metabolite profiling of B. vulgaris by LC-MS. A and D, Overlapped total ion chromatograms (TIC) of 20 P-type and 20 G-type plants (A) and of the nine most susceptible and nine most resistant F2 extremes (D). B and C, Extracted ion chromatograms (EIC) of m/z 803 (in pink; [M+Na]+ for oleanolic acid cellobioside) and m/z 819 (in cyan; [M+Na]+ for hederagenin cellobioside) of a P-type and a G-type (B) and susceptible and resistant F2 extremes (C). E and F, Example of a baseline-corrected and normalized profile of a P-type (marked in blue) versus a G-type (marked in red; E) and of susceptible (marked in blue) and resistant (marked in red) F2 extremes (F).

