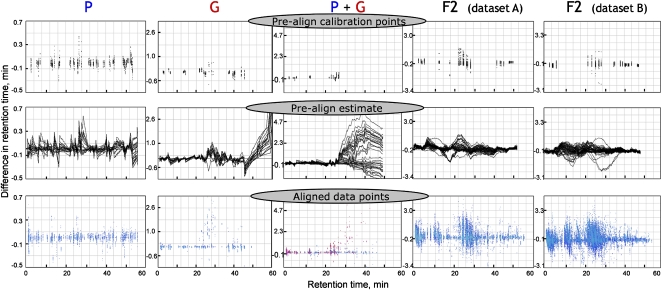
Figure 4.
Differential retention display of F2 plant data sets (A and B) and P and G data sets aligned separately or together, generated by MetAlign, which shows differences in retention between all files referenced with regard to the first data set in the group. When two data sets are aligned together, blue and red points are from data sets of group 1 (P-type) and group 2 (G-type), respectively. Black lines represent “prealign estimates” of retention differences (=final shift correction profiles) between the data sets and data set 1 of group 1. These prealign estimates are calculated by interpolation and extrapolation using prealign calibration points (black points). Prealign calibration points were calculated from chromatographic peaks adhering to restriction parameters of the alignment options and criteria that were selected.

