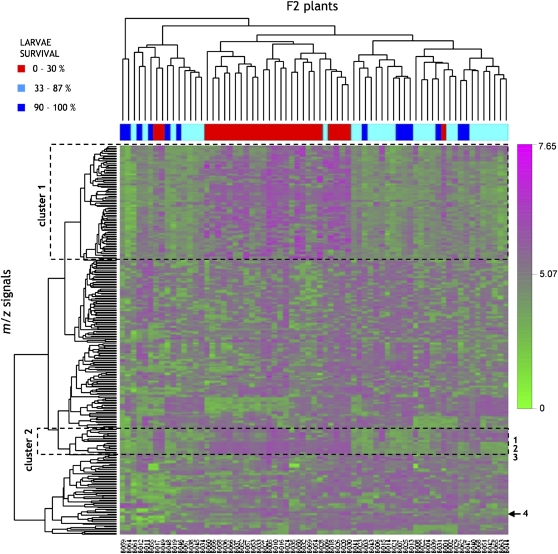
Figure 8.
Heat map for two-way hierarchical clustering of F2 plants and their metabolites (represented as m/z signals). Base peaks of compounds 1 to 4 marked at the right of the heat map are as in Figure 6. Plants are marked with three different colors according to their level of resistance, as in Figure 5. Color scale indicates log10-transformed m/z signal intensities (relative metabolite levels).

