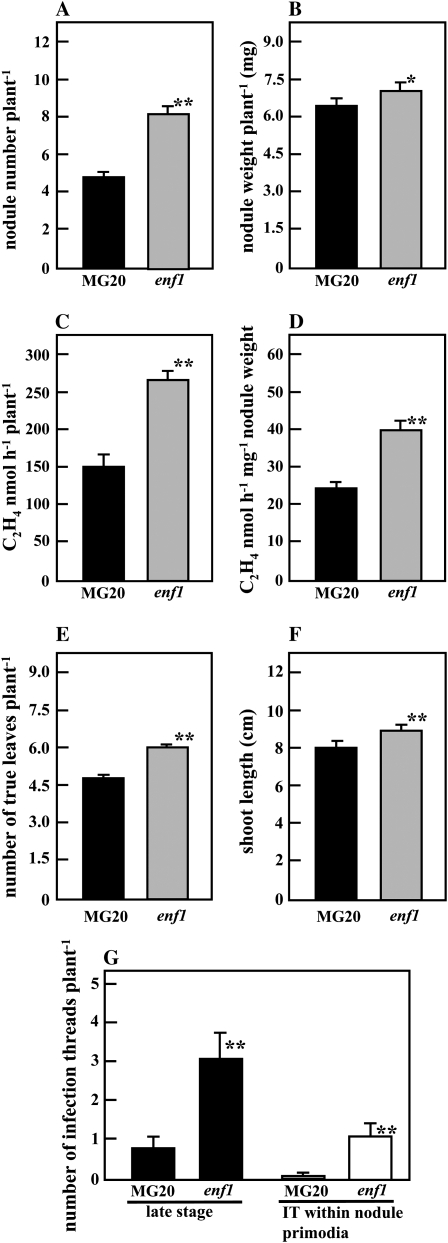
Figure 2.
Analysis of enf1 symbiotic phenotypes. M. loti-inoculated plants were grown for 28 d in pots containing vermiculite and watered with B&D medium (A–F) or grown on B&D agar-solidified (1.5%, w/v) medium for 12 d (G). The plants on the agar plates were inoculated with M. loti NZP2037 carrying plasmid pHC60 (G). A, Nodule number per plant. B, Nodule weight per plant. C and D, Acetylene reduction activity per plant (C) and per nodule weight (D). E, Number of true leaves per plant. F, Shoot length. G, The number of infection threads (IT) per plant at 12 DAI. Black bars indicate MG20, and gray bars indicate enf1 (A –F). In G, black bars indicate later stages of infection thread formation, whereas white bars refer to the initiation of nodule formation. At least 40 plants (A–F) and 17 to 20 plants (G) were examined in each experiment. Error bars represent se. Statistical significance is indicated by asterisks (* P < 0.05, ** P < 0.01, by Student's t test).

