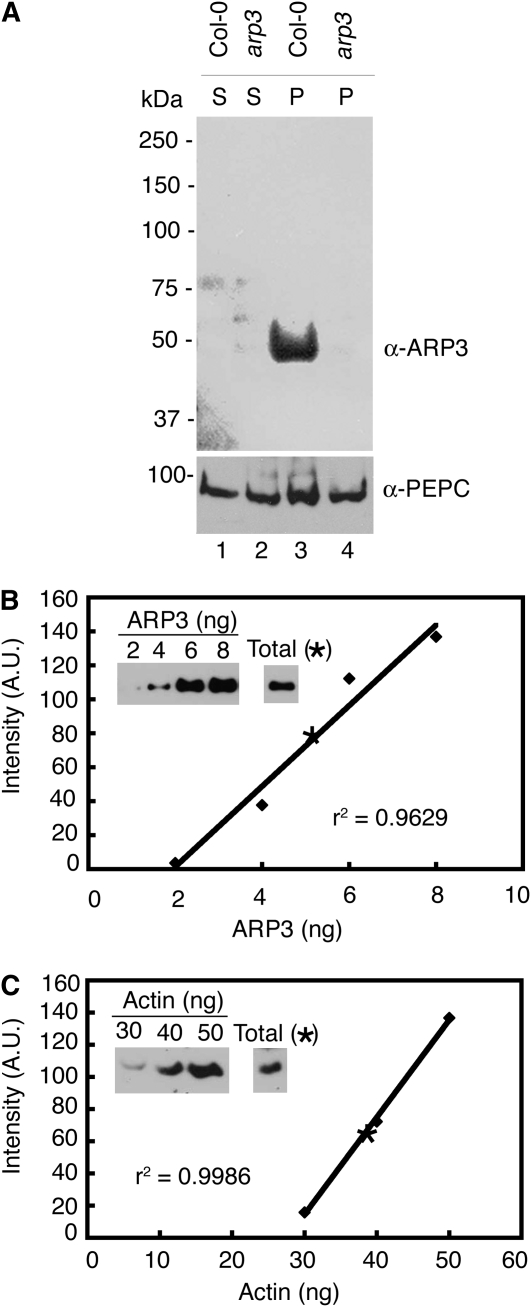
Figure 5.
The endogenous ARP2/3 complex is moderately abundant compared with actin. A, The anti-ARP3 antibody is specific and most prominently detects a single protein at the expected mass for ARP3 (Col-0; lane 3). No corresponding band is present when protein extracts from arp3 (dis1) are probed under identical conditions. An antibody against PEPC was used to probe the same filters and demonstrate similar loading between genotypes. P, Pellet; S, soluble. B, The abundance of endogenous ARP3 (see band intensity indicated as a star in the standard curve) as a percentage of total protein was quantified using purified ARP3 inclusion bodies, which was the source of the original antigen, as a standard (see “Materials and Methods”). Western-blot signals were quantified by densitometry using ImageQuant 5.2 software analyzer. C, ACTIN content was also measured as described above. Vertebrate actin was used as a standard. r2 is the correlation coefficient showing how well the standard curve data points fit the line. A.U., Arbitrary unit.

