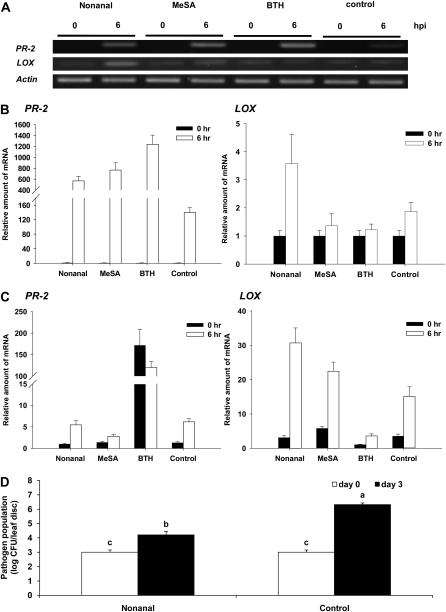
Figure 5.
Expression of PR-2 and LOX in lima bean plants treated with individual volatiles and then challenged with pathogens. Expression rates of PR-2 and LOX were studied after exposing plants to gaseous nonanal and MeSA and compared with plants directly treated with BTH and with paste controls. A, Results of RT-PCR analyses after VOC exposition. B and C, The expression rates as quantified with qRT-PCR after the same chemical treatments (B) and pathogen challenge (C). D, The bacterial population of P. syringae of the respective leaf disc applied by nonanal in the lanolin paste and lanolin alone (control) at 0 and 3 d after pathogen challenge. Bars represent means ± se. Sample size was n = 5 plants per treatment, and different letters indicate significant differences among treatments (P < 0.05 according to lsd). The experiments were repeated three times with similar results.

