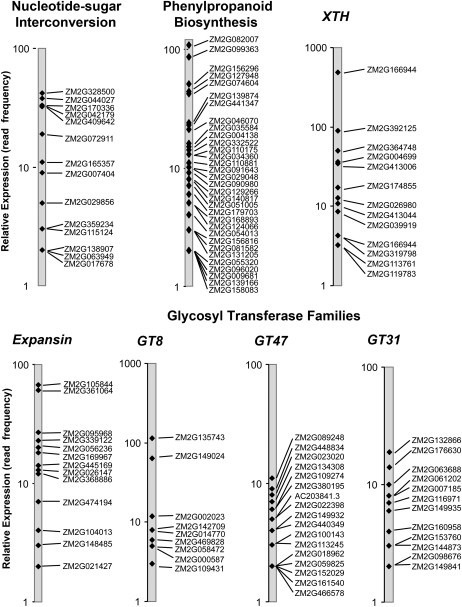
Figure 8.
Expression profiles of cell wall genes in developing maize ovaries. Maize cell wall genes were classified by function according to pathway and/or gene family (the latter as defined in Figs. 1–7; Supplemental Figs. S1–S3). Relative transcript abundance within each class was quantified by the frequency of 3′ UTR-anchored cDNA sequences (number of reads) from each transcript in the data set of Eveland et al. (2008). The sequence counts for each transcript are plotted on a log scale (note range in abundance). Transcripts are labeled with their ZM2G maize sequence identifiers (maizesequence.org). The groups shown include two major biosynthetic processes, nucleotide sugar interconversion (1.1) and phenylpropanoid biosynthesis (1.3), and five large gene families, xyloglucan endotransglucosylase/hydrolases (4.2), expansins (4.1.1), GT8 (2.3.1), GT47 (2.3.2), and GT31 (2.3.5). See Supplemental Table S1 for mRNAs of cell wall genes not shown here.

