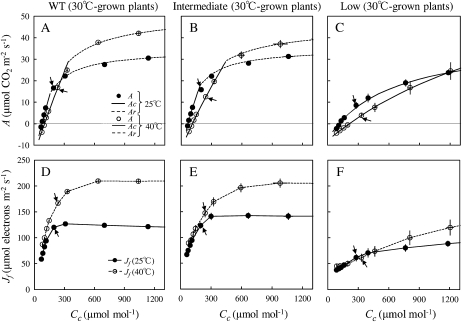
Figure 4.
A to C, CO2 response of CO2 assimilation rate (A) measured at 25°C and 40°C and 1,500 μmol photons m−2 s−1 in wild-type (WT) plants (A), plants with intermediate Rubisco activase contents (B), and plants with low Rubisco activase contents (C) grown at 30°C/25°C. The explanation of plant classification is given in Table I. A at 25°C is shown as black circles, whereas A at 40°C is shown as white circles. Rubisco-limited A (Ac; solid lines) was estimated from Equation 1, whereas RuBP regeneration-limited A (Ar; dotted lines) was estimated from Equation 2. D to F, Electron transport rate from chlorophyll fluorescence (Jf) as a function of chloroplast CO2 concentration (Cc) at 25°C and 40°C in wild-type plants (D), plants with intermediate Rubisco activase contents (E), and plants with low Rubisco activase contents (F) grown at 20°C/15°C. Jf at 25°C is shown as black circles, whereas Jf at 40°C is shown as white circles. Arrows show measurements made at 380 μL L−1 CO2 concentration. Data represent means ± se; n = 4.

