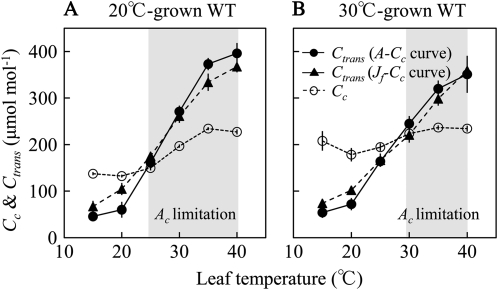
Figure 5.
Temperature dependence of chloroplast CO2 concentration (Ctrans) at which the transition from Rubisco (Ac) to RuBP regeneration (Ar) limitation occurs (black symbols) and chloroplast CO2 concentration (Cc) for CO2 assimilation rate measured at Ca = 380 μmol mol−1 (white symbols) in 20°C-grown wild-type (WT; A) and 30°C-grown wild-type (B) plants. Ctrans was analyzed from two methods. First, A-Cc curve was analyzed for Ctrans (A-Cc curve; black circles), based on the C3 photosynthesis model (Eq. 3). Second, Jf-Cc curve was analyzed to obtain the chloroplast CO2 concentration at which electron transport rate (Jf) remains constant [Ctrans (Jf-Cc curve); black triangles]. Cc for A380 less than the Ctrans indicates that CO2 assimilation is limited by Ar, whereas Cc for A380 above Ctrans indicates that CO2 assimilation is limited by Ac (gray areas). Data represent means ± se; n = 4.

