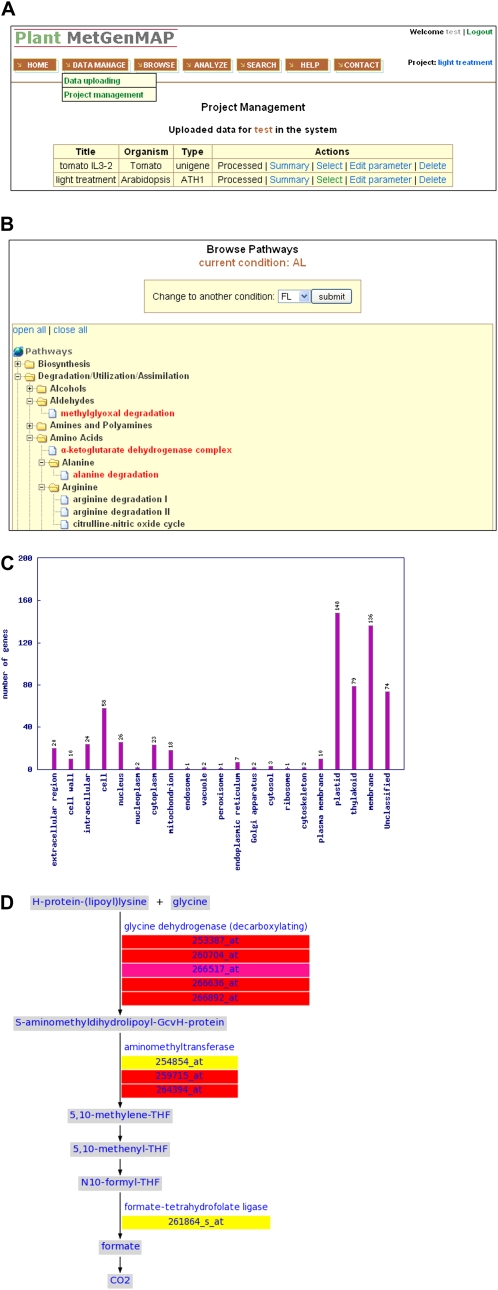
Figure 2.
Screen images of the Plant MetGenMAP system. A, Data management system in Plant MetGenMAP. B, Tree view of all metabolic pathways under a specific experimental condition with altered pathways shown in red. C, Sample output of gene functional classification. D, Visualization of an altered pathway. Changes of gene and metabolite levels as well as the significance of the changes are represented by different background colors.

