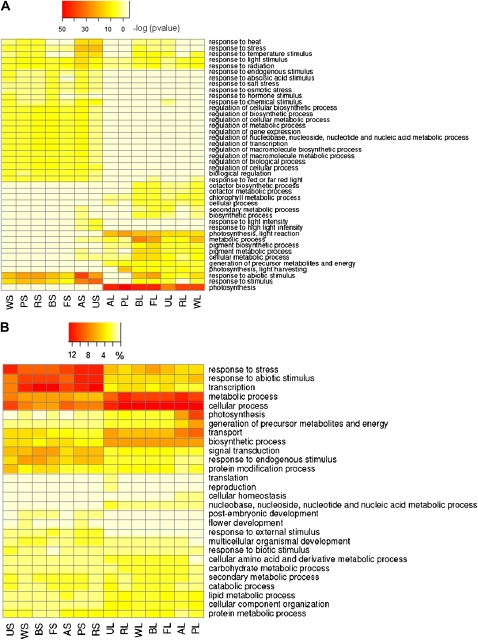
Figure 3.
Functional analysis of gene expression profiles under light treatments in Arabidopsis. A, Significantly enriched GO terms of the biological process category identified from up-regulated genes in each of 14 light treatments with a P value cutoff of less than 1.0e-10 in at least one light treatment. Numbers on the color bar indicate −log(P value), where P value represents the significance of the enrichment. B, Functional classification of genes up-regulated in each of the 14 light treatments. The genes were classified into a set of plant-specific GO slims of the biological process category. Numbers on the color bar represent the percentage of genes classified into a specific GO slim. AL, BL, FL, PL, RL, UL, and WL represent long-term (4 h) treatment of UV-A/dark, blue, far-red, red/dark, red, UV-A/B/dark, and white light, respectively; AS, BS, FS, PS, RS, US, and WS represent short-term (40 min) treatment of UV-A/dark, blue, far-red, red/dark, red, UV-A/B/dark, and white light, respectively. A detailed description of each light treatment is available in Supplemental Table S1.

