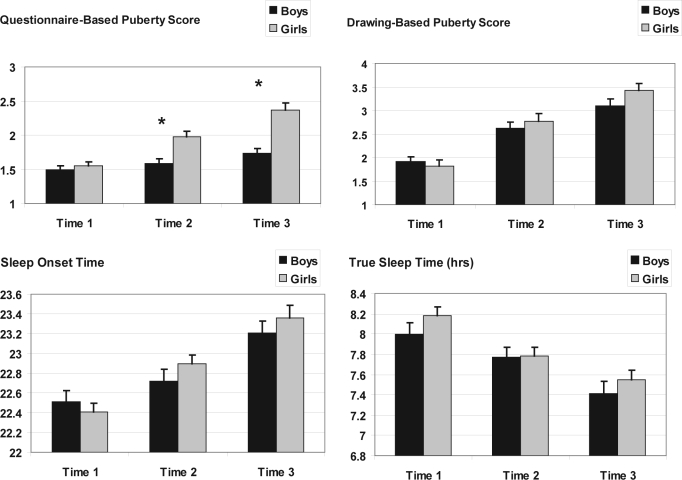
Figure 1.
Developmental changes in sleep and puberty rating. Time 1, 2, and 3 refer to measurement points. At Time 1, the average age was 10.5 y and at Time 2 and Time 3, 11.5 and 12.5 y, respectively. The left upper figure is based on the PDS and the right upper figure is based on the SMS. Sleep measures are based on actigraphy. Post hoc analysis revealed that all discrete differences between Time 1, Time 2, and Time 3 are statistically significant. Significant gender differences are marked by *.

