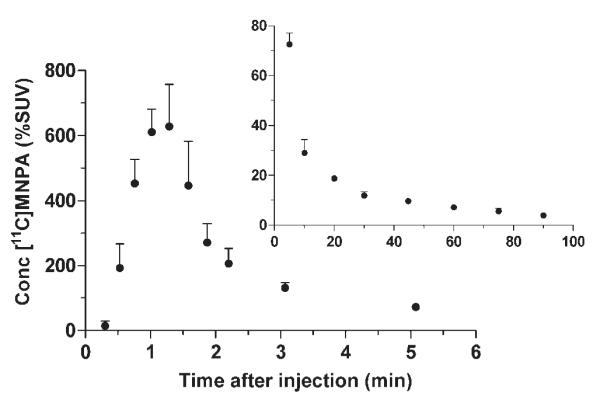
Fig. 2.

Concentration of [11C]MNPA in plasma after radioligand injection. The curve is shown with two time intervals (0–6 and 6–90 min) because of high concentrations at early time points. Concentrations are plotted for unchanged parent radioligand [11C]MNPA.
