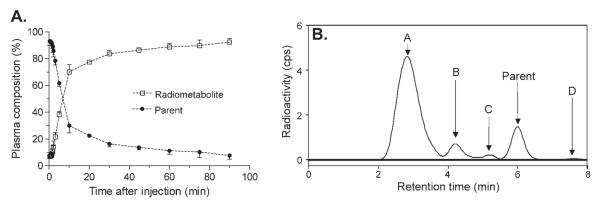
Fig. 3.
(A) The percentage composition of plasma radioactivity over time is shown for [11C]MNPA (•) and total radiometabolites (□) (n = 3). (B) Chromatogram of radioactivity (counts per second (CPS)) extracted from plasma at 60 min after injection of [11C]MNPA. Parent in plasma constituted 14% of total radioactivity. Radiometabolites (A–C) have lower lipophilicity than that of [11C]MNPA.

