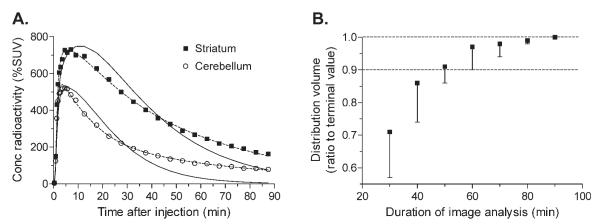
Fig. 4.
Compartmental modeling of dynamic PET images. (A) The two-tissue compartmental model (dashed lines) more closely followed the measured values than did the one-tissue compartmental model (solid lines). (B) Time stability of VT determined from the two-tissue compartmental model was assessed by analyzing increasingly truncated data, with a range of 0–30 min to 0–90 min. Each point represents the striatal VT analyzed with data from time 0 to the specified time and expressed as the percentage of the 90-min value.

