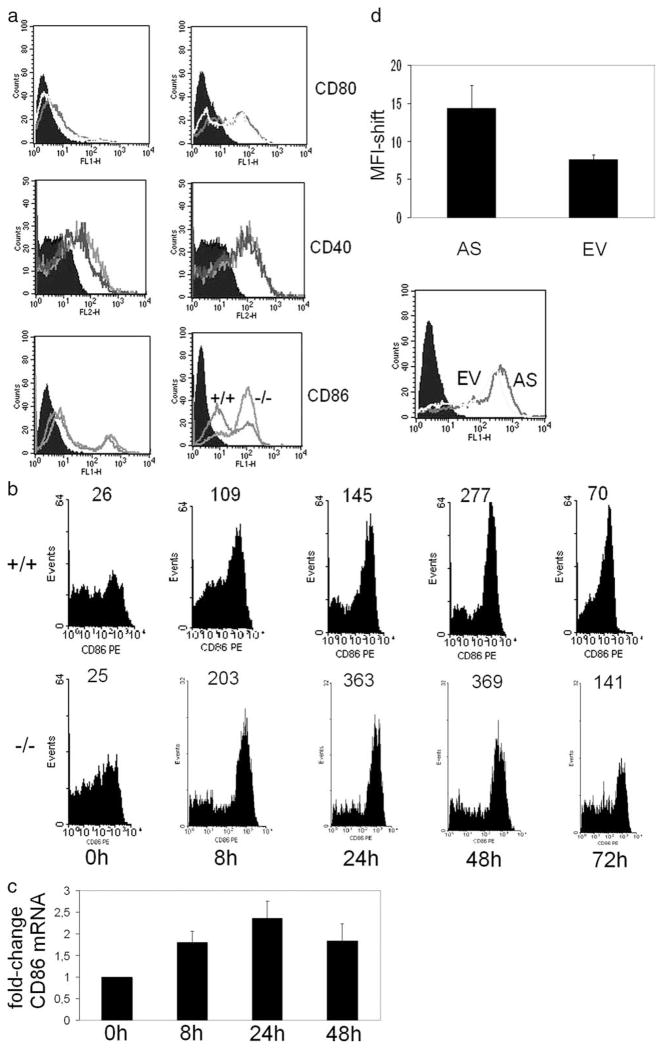
FIGURE 2.
Enhanced expression of CD86 by CREM-deficient DCs. a, BMDCs from Crem−/− and Crem+/+ animals were either left unstimulated or were stimulated with LPS for 24 h and stained with Abs against CD40, CD80, and CD86. CD86 staining shows the isotypic control (filled histogram), the CD86 expression of the Crem+/+ mice, and the CD86 expression of the Crem−/− mice (n = 3 animals each) for four experiments completed. b, BMDCs from Crem−/− and Crem+/+ animals were either left unstimulated or were stimulated with LPS for depicted time points with Abs against CD86. Number at top of peaks represents mean fluorescent intensity (n = 3 animals each) for two experiments performed. c, BMDCs from Crem+/+ animals were either left unstimulated or were stimulated with LPS for depicted time points. mRNA was extracted and real-time PCR was performed with primers specific for CD86 (n = 3 animals each) for two experiments completed. Data show fold-change relative to gapdh expression. d, U937 cells were transfected with an antisense CREM construct (AS) or an empty-vector construct (EV) together with a GFP construct. CD86 expression on cell surface was measured by flow cytometric analysis 24 h after transfection within a gate set on GFP-positive cells. Mean fluorescence intensity was calculated with error bar representing SEM (n = 6 experiments, p = 0.006, paired t test). Empty vector (gray line histogram) and antisense CREM (black line histogram) are shown (bottom).

