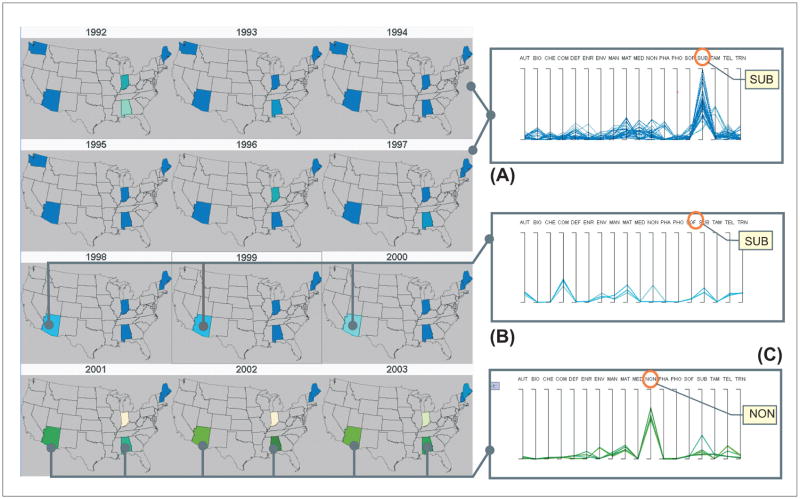
Figure 12.
A map matrix screen shot (left) displays how industry mix (a multivariate pattern) changes across the six states over twelve years. Three PCP displays outcomes of three selection operations, respectively, each of which was visible separately at different points in the interactive analysis sequence (A, B, and C). The three selection are: (A) Select six states from 1992 to 1997: five states except New Hampshire are in blue (an industry mix dominated by SUB, indicating the five states focused on SUB; (B) Select Arizona from 1998 to 2000: Arizona switched focus to COM, NON, MAT, but still kept some SUB. (C) Select Arizona and Alabama from 2001 to 2003; they switched focus to NON. Because only Maine and New Hampshire remain in blue (an industry mix dominated by SUB), we can conclude that SUB expanded from Maine to New Hampshire, while decreasing significantly in the other states after 2001.

