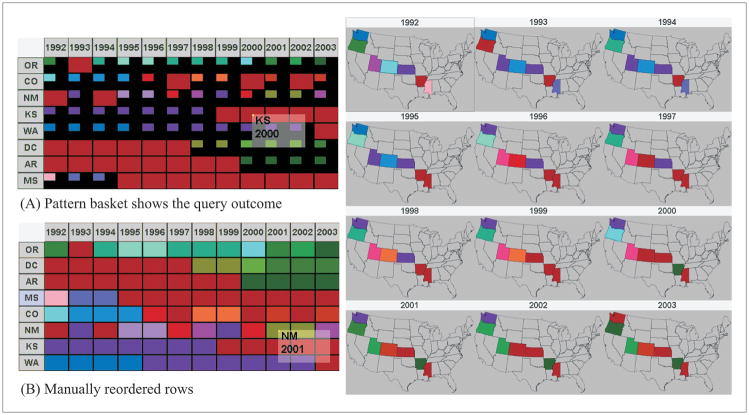
Figure 13.
States previously focused on TEL industry are exported into the Pattern Basket (snapshot A on the left). A state–year that focused on TEL is represented by a red matrix cell (or a geographic unit in a map). Those states (Oregon, Washington) having few red cells are unimportant and are therefore removed. Then the matrix rows in the Pattern Basket are manually reordered as shown in the snapshot B. Previously hidden spatio-temporal patterns are exposed: Washington, D.C. and Arkansas changed color from red to green in the late 1990s, indicating a switch in focus from TEL to NON industry during the time. Mississippi, Colorado, and Kansas switched to TEL in later years.

