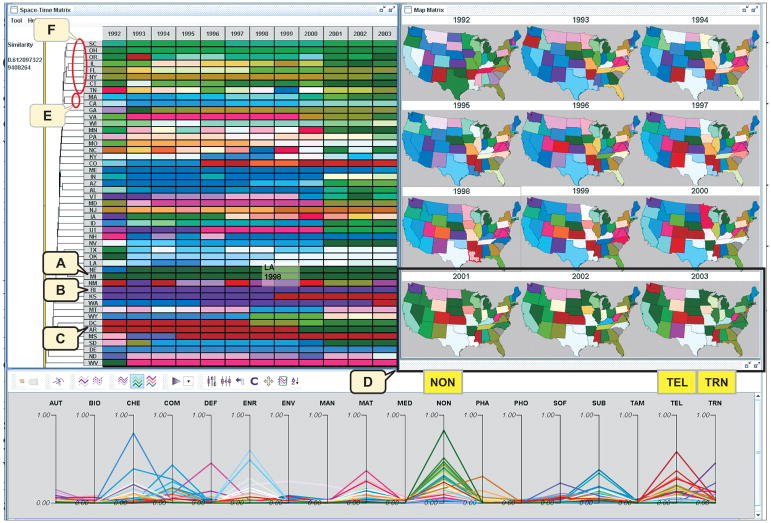
Figure 7.
An overall view of spatio-temporal multivariate patterns. The PCP is in overview mode showing clusters rather than individual state–year composition. (A) Green clusters: Nevada and Michigan have NON as the dominant industry in all the years. (B) Purple clusters: Rhode Island, Kansas, and Washington have TRN as the dominant industry in most years. (C) Red clusters: Washington, DC, Arkansas, Mississippi, and Kansas have TEL as the dominant industry in some periods. (D) In the last row of the map matrix (2001–2003), many states change to green, indicating a shift in relative importance of non-primary high tech industry.

