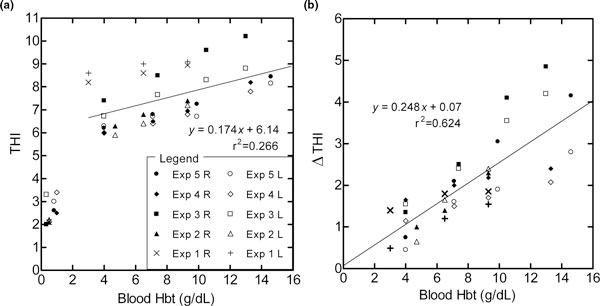
Figure 4.
Correlation of tissue hemoglobin index to arterial blood hemoglobin concentration during isovolumetric hemodilution. As shown in the legend the (a) baseline THI values, and (b) change in THI during 3-minute venous occlusion (ΔTHI) are from five animal experiments (Exp 1 to Exp 5) in which both right (R) and left (L) hind limbs were simultaneously measured. The right limb had the femoral artery and vein surgically accessed to locate annular ring flow transducers, and generally had higher (a) THI (mean difference 0.32, P = 0.05) and (b) ΔTHI (mean difference 0.44, P < 0.05).

