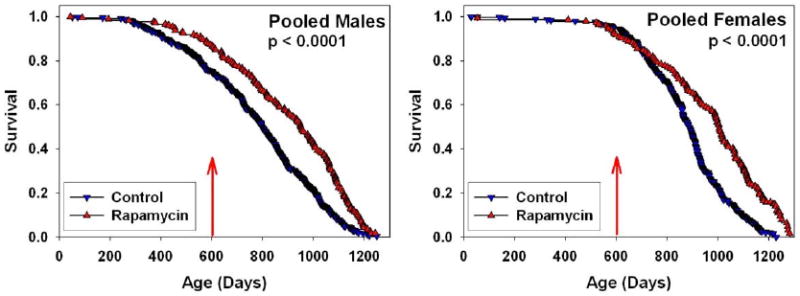
Figure 1.

Survival plots for male (left) and female (right) mice, comparing control mice to those fed rapamycin in the diet starting at 600 days of age, pooling across the three test sites. P-values were calculated by the log-rank test. 4% of the control mice, and 3% of rapamycin-assigned mice were removed from the experiment for technical reasons. Only 5 animals (3 controls, 2 rapamycin) were removed after the start of rapamycin treatment at 600 days. Thus there were no significant differences between groups in censoring.
