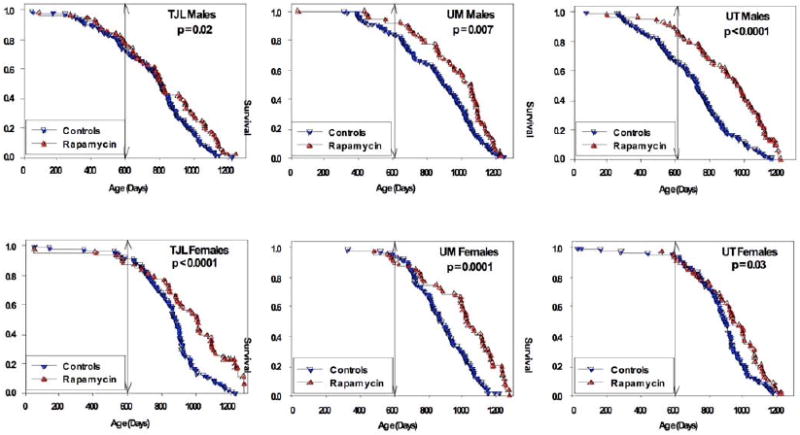
Figure 2.

Survival of control and rapamycin-treated mice for males (top) and females (bottom) for each of the three test sites separately. P-values represent results of log-rank calculations. Vertical lines at age 600 days indicate the age at which the mice were first exposed to rapamycin.
