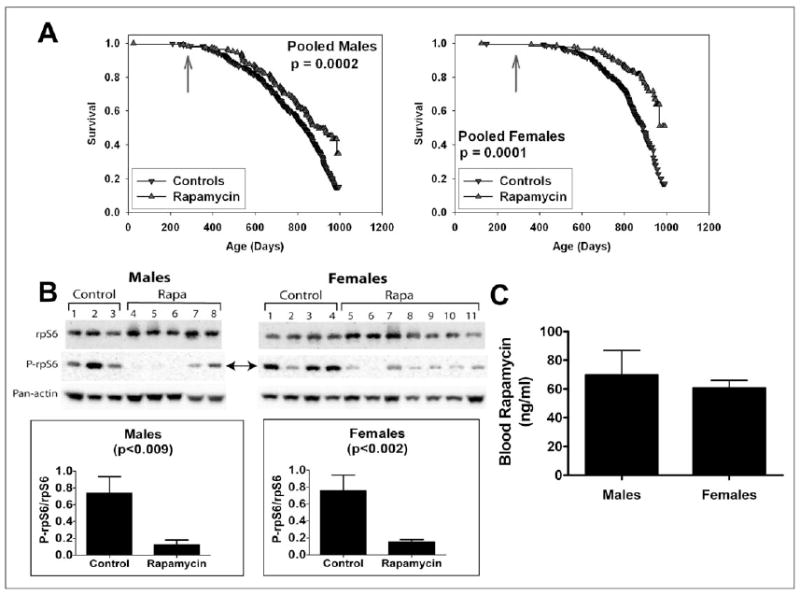
Figure 3.

A. Survival plots for male (left) and female (right) mice, comparing control mice to rapamycin-treated mice of a separate (“Cohort 2006”) population, in which mice were treated with rapamycin from 270 days of age. Because at the time of the interim analysis all live mice were between 800 and 995 days of age, we have only limited information about the shape of the survival curve at ages above 900 days, and the apparent change in slope at the oldest ages (> 990 days) reflects this experimental uncertainty. P-values calculated by the log-rank test. B. Effects of dietary rapamycin on an mTORC1 effector in the visceral fat pads from 750- to 880-day-old male and female mice. Ribosomal subunit protein S6 (rpS6) and its phosphorylation status (P-rpS6 - double arrow) were immunoassayed in tissue lysates prepared from mice consuming microencapsulated rapamycin-containing (Rapa) or control diets. Antibodies used are shown to the left. The ratio of intensity values for P-rpS6: rpS6 are shown in the graphs for females and males. Pan-actin was also immunoassayed in the blots to provide an indication of protein loading for each lane. C. Whole blood rapamycin content in 750- to 880-day-old male and female mice.
