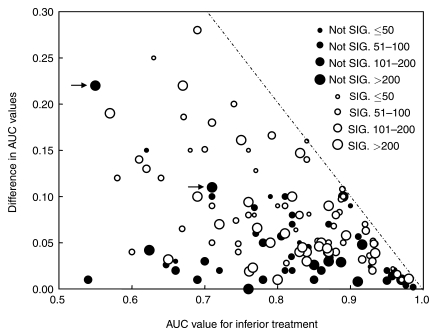
Figure 5:
Scatterplot of the relationship between differences in pairs of AUCs obtained when comparing two different treatments and AUC for the inferior treatment in each pair, with indication of finding significance and number of cases in the key. Two ROC studies (arrows) were performed by the same research group and employed a similar experimental design (phantom images as a clustered case sample; four observers; LABMRMC software used). Most likely cause of nonsignificant results is a small number of observers. Dashed line = theoretical maximum difference in AUC for the AUC for inferior treatment. Not SIG. = not significant, SIG. = significant.

