
Fig. 3.
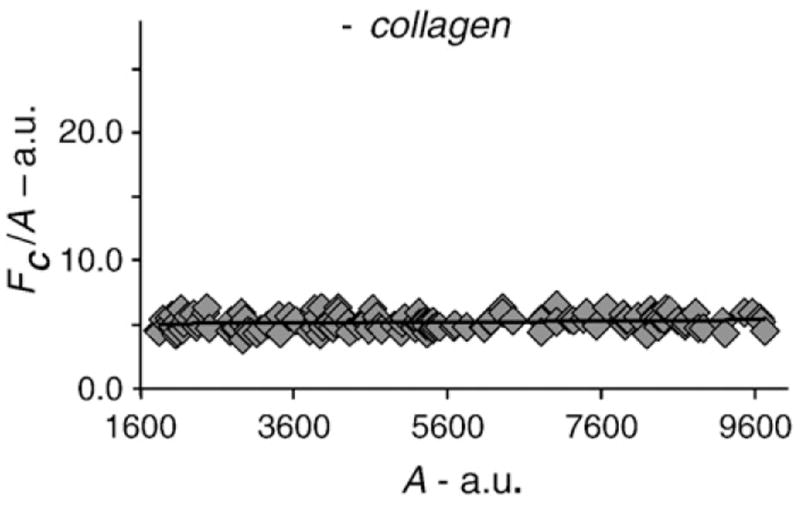
The FRET index was plotted against the acceptor levels for nonstimulated samples. All data points (ROIs) included have similar A/D ratios, and the FRET index shows little dependence on the receptor levels.
Official websites use .gov
A
.gov website belongs to an official
government organization in the United States.
Secure .gov websites use HTTPS
A lock (
) or https:// means you've safely
connected to the .gov website. Share sensitive
information only on official, secure websites.
The FRET index was plotted against the acceptor levels for nonstimulated samples. All data points (ROIs) included have similar A/D ratios, and the FRET index shows little dependence on the receptor levels.