
Fig. 7.
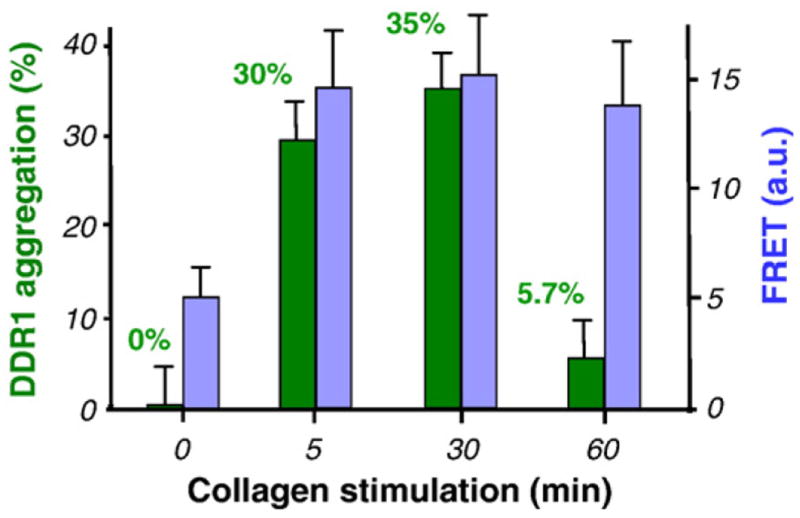
Quantitative analysis of the aggregation process depicted in Fig. 6. Aggregation percentage is depicted in green (left axis), together with the increase in FRET (blue; right axis). The two processes are shown to have similar dynamics in the initial phase, with a sharp increase immediately following collagen stimulation and little variation thereafter. Later time points (60 min) show redistribution of the DDR1 aggregates, while the FRET index in the remaining aggregates is similar to that recorded at earlier stimulation points.