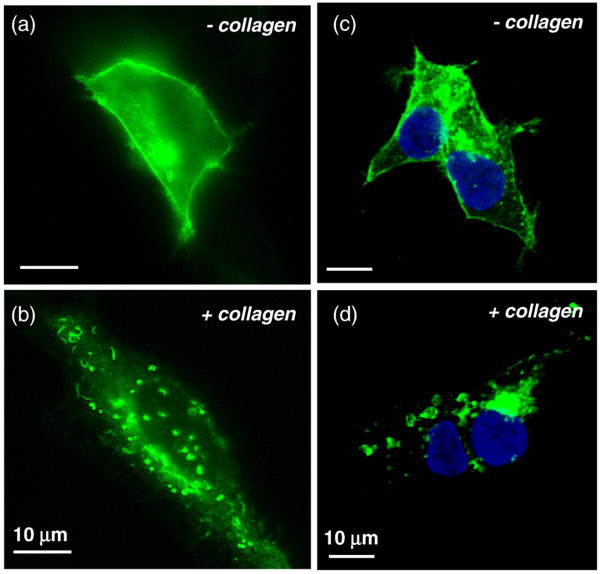
Fig. 8.
DDR1 aggregation takes place through receptor internalization. HEK293 cells were cultured on glass-bottom culture dishes, transiently transfected with DDR1–YFP, and stimulated with collagen type I for 10 min (as indicated). Following stimulation, cells were imaged live using wide-field fluorescence microscopy (a and b). Nonstimulated sample (a) shows localization of the receptor on the cell membrane. (b) Stimulated sample shows loss of fluorescence from the membrane and aggregation of the receptors. Confocal imaging of fixed cells confirms localization of the receptor on the cell membrane in the nonstimulated sample (c), while stimulated cells (d) show a loss of receptor signal from the membrane accompanied by aggregation inside the cytoplasm. Nuclear staining is shown in blue. All scale bars represent 10 μm.

