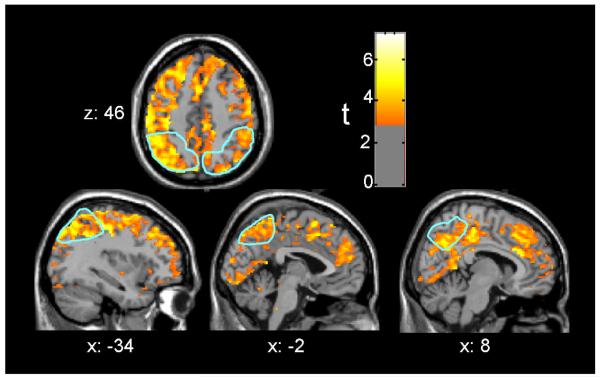
Figure 1. Parietal cortex CMRglc increased between sessions in the MA abuse group, more than in the control group.
The figures are depicted in neurological orientation. The gray-scale image is a T1 structural MRI that is representative of MNI space, where positive values of the x, y, and z coordinates approximately represent mm to the right, anterior and superior relative to the sagittal midpoint of the anterior commissure. The a priori parietal lobe regions of interest (ROIs) are outlined in light blue. Red/yellow colors indicate greater increases in CMRglc from initial PET session to four weeks later in 9 MA, as compared to 7 control subjects (p < .01 uncorrected).

