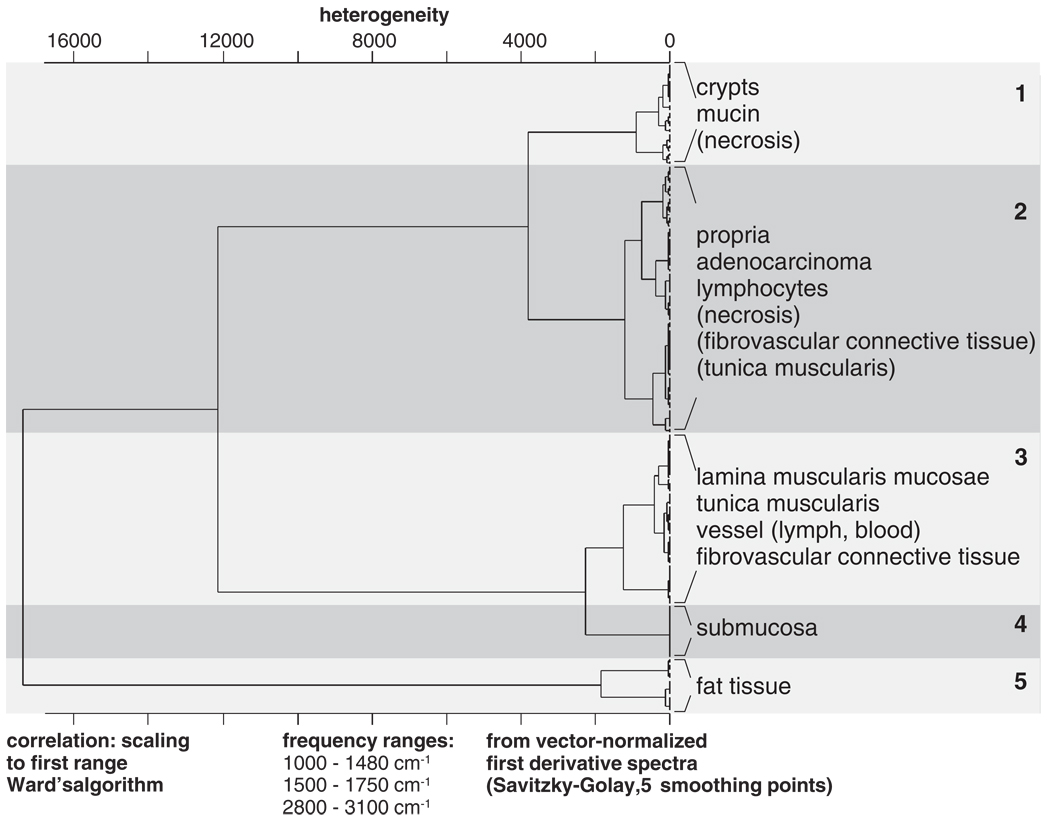
Figure 1.
Dendrogram produced by agglomerative hierarchical clustering (HCA) of representative FT-IR spectra from the colon database. At least two spectra per spectral class and patient were selected for the analysis. The dendrogram illustrates that spectra from fat tissue and the submucosa can be easily differentiated from the majority of the database spectra. HCA classification of the remaining spectra yielded in a number of cases ambiguous results illustrating that unsupervised cluster analysis alone cannot be used to attain consistent classification results (see text for details).

