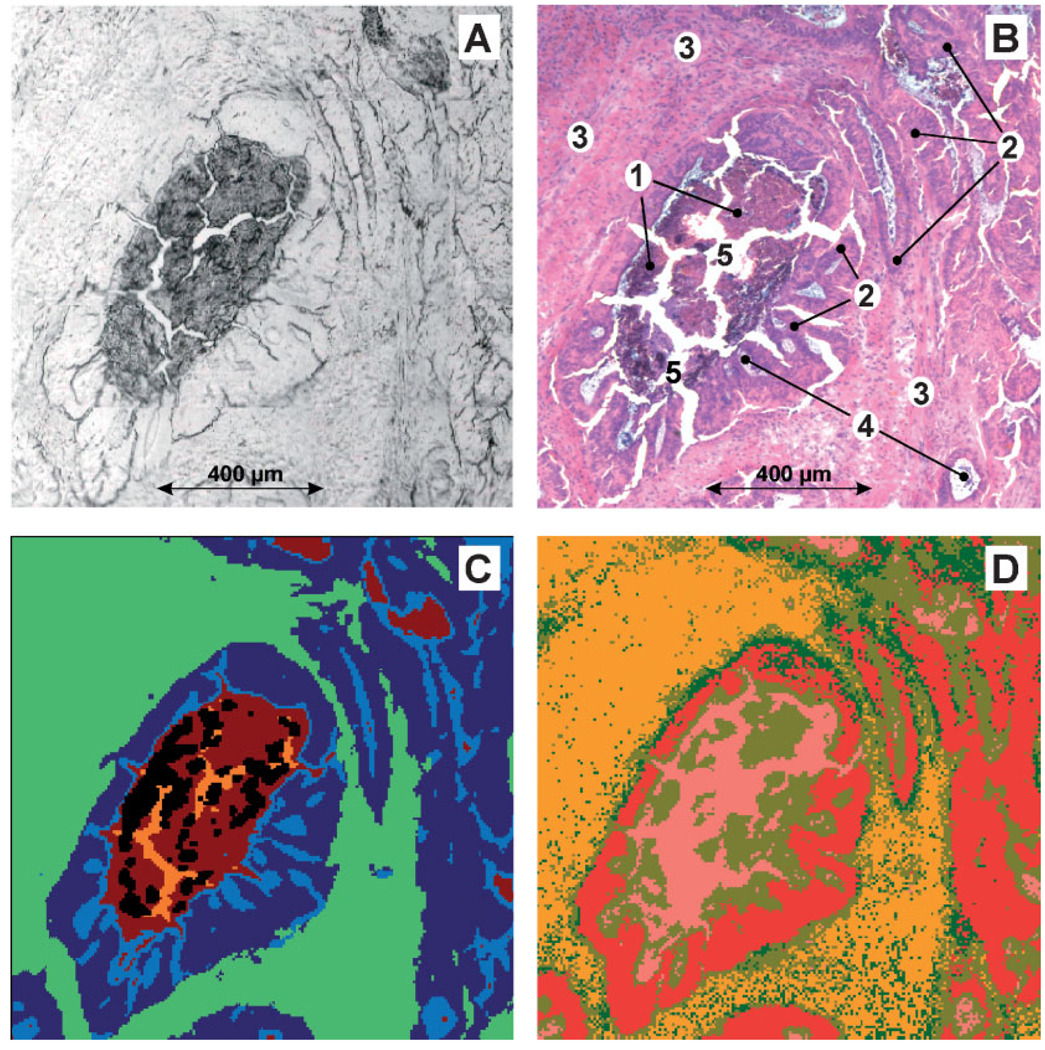
Figure 3.
FT-IR microspectroscopic imaging of a cryostat section from a well differentiated (G1) adenocarcinoma of the rectum. (A) Photomicrograph of the unstained cryostat section. Sample area: 1206 × 1231 µm2. (B) Tissue area shown in A after IR microspectroscopy and staining with H&E. 1, necrotic detritus; 2, vital tumour cells; 3, fibrovascular connective tissue and smooth muscle strands; 4, secretion products (mucin); 5, tissue clefts. (C) IR imaging based on 192 × 194 microspectra of the tissue area shown in panel A and hierarchical cluster analysis (five class classification approach). (D) Imaging based on FT-IR microspectroscopy and ANN analysis (‘top-level net’). See text for details.

